Prometheus is a popular solution for Kubernetes monitoring and alerting. The kube-prometheus-stack project is a collection of Kubernetes manifests, Grafana dashboards, and Prometheus rules that provides an easy to manage Kubernetes cluster monitoring solution. The project includes the Prometheus Operator, Prometheus, Alertmanager, Grafana, and more. The kube-prometheus stack is pre-configured to collect metrics from all Kubernetes components, and includes pre-configured dashboards and alerting rules specific to the Kubernetes components found in the kube-system namespace.
Prometheus community Helm charts make deploying the kube-prometheus stack simple. A few configuration changes must be made to use Prometheus to monitor the LINBIT SDS namespace in Kubernetes, but the LINBIT Operator’s lead developer, Moritz Wanzenböck, has made getting started as simple as possible. You can watch Moritz demonstrate his development during LINBIT’s January 2024 community meeting.
The LINSTOR Operator project’s Helm charts include pre-configured Grafana dashboards and alerting rules. The included dashboard could be used as-is, or as a starting point, for monitoring and alerting within your LINBIT SDS deployment in Kubernetes. This blog post will highlight how easy it is to set up monitoring and alerting for LINBIT SDS events in Kubernetes.
Deploying the Prometheus Operator
First, you’ll want to have deployed LNBIT SDS into your Kubernetes cluster and conifgured a LINSTOR backed storageClass. A LINSTOR storageClass isn’t a hard requirement if you have another persistent storage solution for Kubernetes, or if you’re only testing and are not concerned with persisting your Prometheus metrics or changes you make to your Grafana dashboards.
You can then add the Prometheus community Helm charts to your local Helm repositories:
helm repo add prometheus-community https://prometheus-community.github.io/helm-charts
helm repo update
Create an override-values file for the kube-prometheus stack using the following command:
cat << EOF > prometheus.yaml
prometheus:
  prometheusSpec:
    serviceMonitorSelectorNilUsesHelmValues: false
    podMonitorSelectorNilUsesHelmValues: false
    ruleSelectorNilUsesHelmValues: false
    storageSpec:
      volumeClaimTemplate:
        spec:
          storageClassName: linstor-csi-lvm-thin-r2
          accessModes: ["ReadWriteOnce"]
          resources:
            requests:
              storage: 50Gi
EOF
In addition to specifying the LINTOR storageClass that the kube-prometheus stack will use for persistence, the override-values file also defines the necessary options for configuring Prometheus to monitor not only the kube-system namespace and its own namespace, but all namespaces within the Kubernetes cluster. If you have configured a default storageClass configured in Kubernetes that you’d like to use for persistence, you can omit the storageClassName from the VolumeClaimTemplate, otherwise be sure to change the value to match the appropriate storageClassName in your cluster.
Finally, deploy the kube-prometheus stack into a new monitoring namespace by using Helm, and by overriding the necessary configuration values by using the file that you created with the previous command.
helm install --create-namespace --namespace monitoring prometheus prometheus-community/kube-prometheus-stack --values prometheus.yaml
Shortly after installation, you will see that you have a slew of new pods running in the monitoring namespace:
kubectl --namespace monitoring get pods
Applying LINBIT SDS Monitoring Rules and Dashboard
You can apply the LINBIT SDS pre-configured Prometheus rules and Grafana dashboard by using a single command. How you’ve configured and deployed LINBIT SDS into Kubernetes will determine which “single command” you should use.
If you deployed LINBIT SDS using Kustomize, the Kubernetes configuration management tool built into kubectl, and you did not enable SSL/TLS, then use the following command:
kubectl apply -k \
  "https://github.com/linbit/linstor-operator-builder//config/monitoring?ref=v2"
If you used Kustomize and have deployed LINBIT SDS using SSL/TLS, then the following command should be used:
kubectl apply -k \
  "https://github.com/linbit/linstor-operator-builder//config/monitoring-with-api-tls?ref=v2"
If you used Helm to deploy LINBIT SDS, the following command will enable monitoring in your cluster:
helm upgrade --reuse-values linbit-sds linstor/linbit-sds --set monitoring.enabled=true
After running one of the commands above, you will have added new rules in Prometheus and a new Grafana dashboard for monitoring LINBIT SDS.
Viewing and Editing the LINBIT SDS Grafana Dashboard
To log in to the Grafana web console and see the new LINBIT SDS dashboard, forward a local port to the Grafana service:
kubectl port-forward -n monitoring services/prometheus-grafana 3000:80
Then, use a web browser to access the Grafana web console from your local host on the forwarded port, http://127.0.0.1:3000. Log in to the web console by using the default credentials for Grafana as deployed by the kube-prometheus stack: username admin, password prom-operator. After logging in, you can navigate to the Dashboards available in your deployment, then search for and click the “LINBIT SDS” entry to view the LINBIT SDS dashboard which should look something like this:
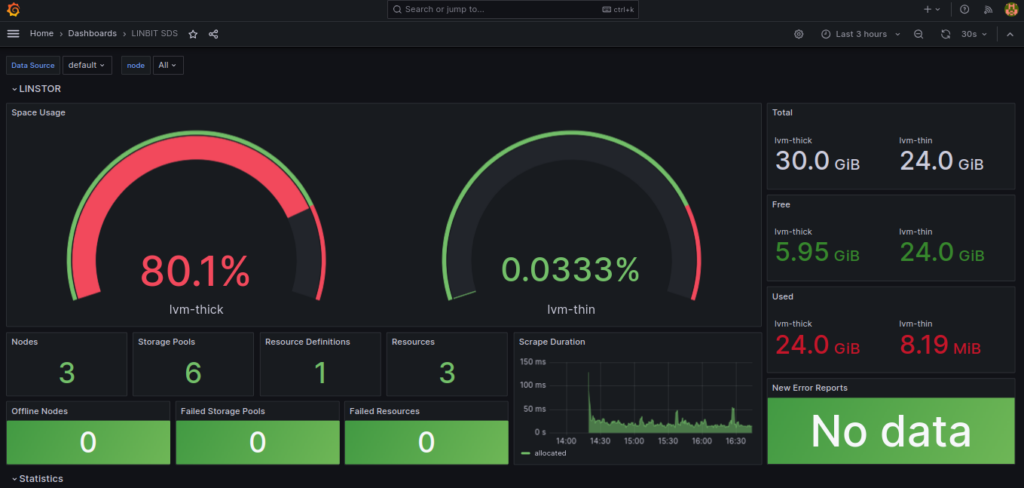
You can change the LINBIT SDS Grafana dashboard as you like. You can add, edit, or remove dashboard elements. However, doing so from the Grafana dashboard UI might not be considered a best practice. Kubernetes configurations are generally maintained in version control to prevent configuration drift and enable collaboration and review. The source code for the included Grafana dashboard can be found in the LINBIT SDS Operator’s GitHub repository and patches should be applied to the Kubernetes ConfigMap named linbit-sds-dashboard in the namespace LINBIT SDS was deployed into (linbit-sds by default).
The steps to get started editing the Grafana dashboard might be something like:
- Obtain a copy of the most current dashboard:
curl -O https://raw.githubusercontent.com/LINBIT/linstor-operator-builder/v2/charts/linbit-sds/dashboard.json. - Edit the configuration and commit to version control.
- Create a
ConfigMapfrom the configuration file usingkubectland apply it as a patch.kubectl create cm linbit-sds-dashboard --from-file=linbit-sds-dashboard.json=dashboard.json --dry-run=client -o yaml |\ kubectl patch cm -n linbit-sds linbit-sds-dashboard --type merge --patch-file /dev/stdin
Configuring Slack Alerts Using Alertmanager
Visualization and monitoring is great, but it’s incomplete without alerting. Luckily, LINBIT SDS includes a set of alerting rules that the kube-prometheus stack imports into its Alertmanager deployment. All that’s left for you to do is to configure how you receive the alerts that Alertmanager generates, which unfortunately, can be a little complicated. Hopefully, the working configuration below can provide some useful hints when setting up your own alerts.
Slack is a popular chat platform used by all kinds or organizations and businesses. It’s relatively easy to create a Slack app, and generate a webhook URL for the app that can be used to send messages into a Slack workspace. After you have created and installed a Slack app that is authorized to write messages into a workspace, you can copy the webhook URL from the app’s settings. Then insert the webhook URL into the configuration file, and the slack channel you want to post to. You can create the configuration file by running the command below:
cat << EOF > slack-alerts.yaml
alertmanager:
  config:
    global:
      slack_api_url: "<redacted_url>"
    route:
      group_by: ['job']
      group_wait: 30s
      group_interval: 5m
      repeat_interval: 12h
      receiver: 'slack'
      routes:
      - match:
          alertname: DeadMansSwitch
        receiver: 'null'
      - match:
        receiver: 'slack'
        continue: true
    receivers:
    - name: 'null'
    - name: 'slack'
      slack_configs:
      - channel: '#<channel_to_post_to>'
        send_resolved: true
        title: '[{{ .Status | toUpper }}{{ if eq .Status "firing" }}:{{ .Alerts.Firing | len }}{{ end }}] Monitoring Event Notification'
        text: >-
          {{ range .Alerts }}
            *Alert:* {{ .Annotations.summary }} - {{ .Labels.severity }}
            *Description:* {{ .Annotations.description }}
            *Graph:* <{{ .GeneratorURL }}|:chart_with_upwards_trend:> *Runbook:* <{{ .Annotations.runbook }}|:spiral_note_pad:>
            *Details:*
            {{ range .Labels.SortedPairs }} • *{{ .Name }}:* {{ .Value }}
            {{ end }}
          {{ end }}
EOF
❗ IMPORTANT: The <redacted_url> and <channel_to_post_to> are placeholders for values that will be specific to your Slack app and workspace.
If you’re not using Slack, refer to the receiver integration settings in the Prometheus documentation for configuring other receivers, such as email, Discord, Telegram, Microsoft Teams, and others. The kube-prometheus stack’s helm charts’ values file might also be useful for fine tuning your configuration.
After modifying the slack-alerts.yaml with your specifics, you can upgrade your Prometheus deployment with the new receiver rules.
helm upgrade --reuse-values --namespace monitoring prometheus prometheus-community/kube-prometheus-stack --values slack-alerts.yaml
Depending on the health of your cluster at this point in time, you might start receiving messages in Slack as soon as the Prometheus operator updates the Alertmanager rules. You can review or silence alerts through the Alertmanager web interface. To access the Alertmanager web interface, you can use kubectl to forward a local port by entering the following command:
kubectl port-forward -n monitoring services/prometheus-kube-prometheus-alertmanager 9093:9093
After forwarding the Alertmanager instance to a local port, you can use a web browser to navigate to the Alertmanager web interface.
Concluding Thoughts
LINBIT SDS has tried to make it as easy as possible to get started monitoring and alerting significant LINSTOR and DRBD events. If there is something you’re routinely adding to your LINBIT SDS monitoring, consider contributing your additions to the LINBIT SDS upstream project, Piraeus Datastore.
Of course, if you need help configuring monitoring for your specific environment, don’t hesitate to reach out and schedule an introductory call, or join the LINBIT forums to ask us and the LINBIT community for advice.