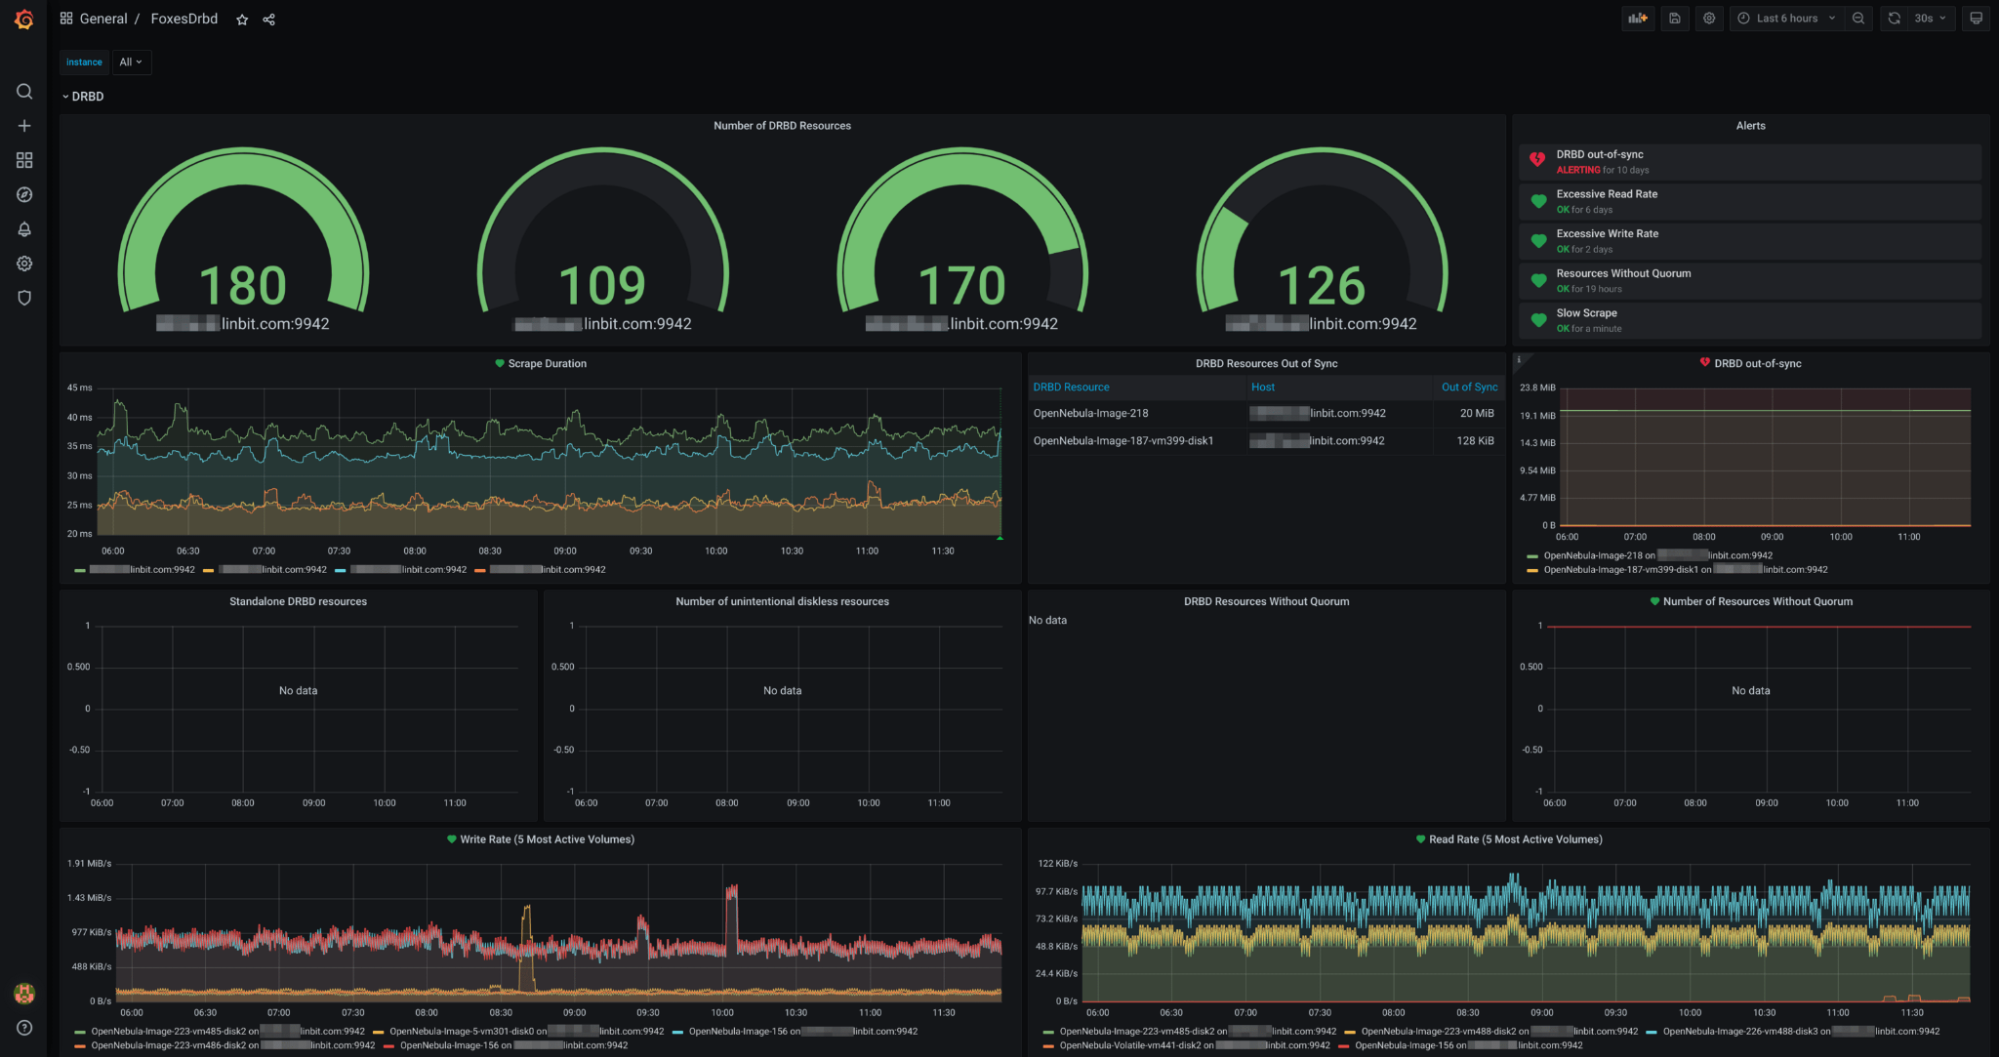
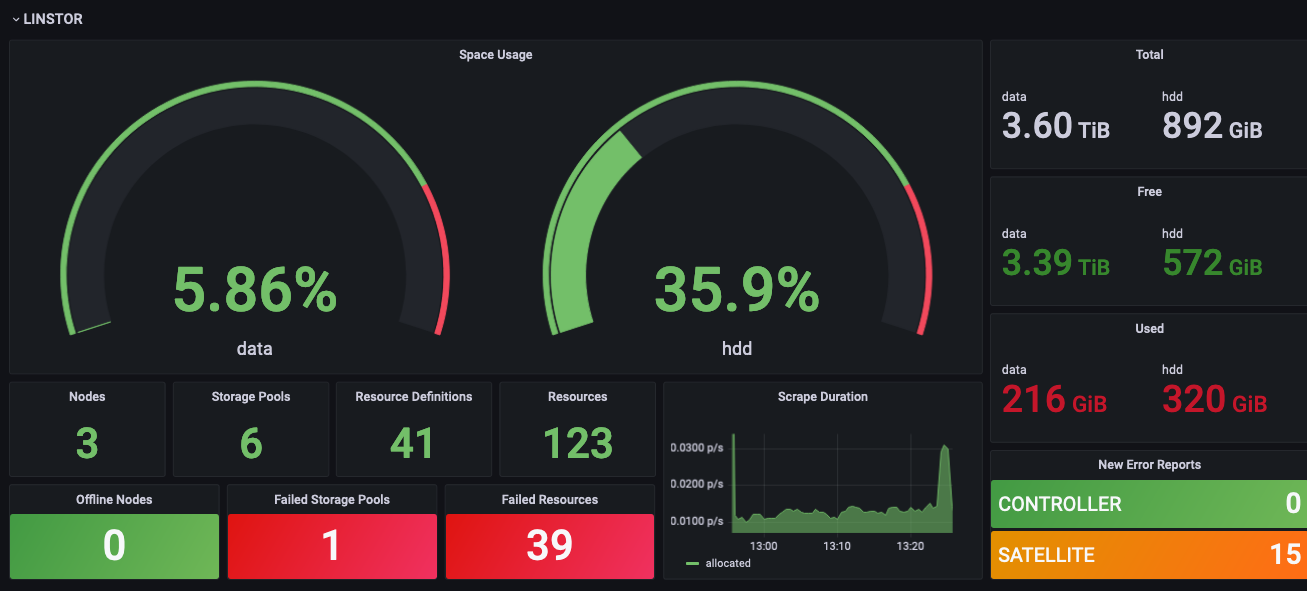
UPDATE 5/15/2023: While the ha_cluster_exporter project is still active and well, LINBIT® now has their own software, DRBD® Reactor, for exporting Prometheus metrics specific to DRBD. This blog post will highlight LINBIT software with native Prometheus instrumentation, as well as pointing you in the right direction for integrating them into your Prometheus monitoring strategy.
Prometheus Monitoring for DRBD using DRBD Reactor
DRBD Reactor is a relatively new software contributed by LINBIT to the Linux HA Clustering world. At its core, DRBD Reactor was designed to process and react to events in a local DRBD cluster as defined by the administrator. Besides acting as an events processor and cluster resource manager for DRBD clusters, DRBD Reactor can also expose Prometheus metrics specific to DRBD for monitoring those clusters.
Configuring DRBD Reactor to export Prometheus metrics is as easy as dropping the following configuration file into DRBD Reactor’s configurations directory and restarting DRBD Reactor:
# cat << EOF > /etc/drbd-reactor.d/prometheus.toml
[[prometheus]]
enums = true
address = "0.0.0.0:9942"
EOF

# systemctl restart drbd-reactor.service
Once restarted, you should be able to curl the metrics endpoint and see the DRBD metrics exposed by DRBD Reactor.
# curl 127.0.0.1:9942
# TYPE drbd_device_alwrites_total counter
# HELP Number of updates of the activity log area of the meta data
drbd_device_alwrites_total{name="linstor_db",volume="0",minor="1000"} 1
# TYPE drbd_resource_resources gauge
# HELP Number of resources
drbd_resource_resources 1
…snip…
For a full list and description of each metric exposed by DRBD Reator, check out the docs on DRBD Reactor’s GitHub.
Prometheus Monitoring for LINSTOR Controllers
LINSTOR® Controllers, the management plane for LINBIT’s software defined storage solution, are also instrumented for Prometheus. The LINSTOR Controller’s Prometheus metrics will show you information pertaining to your LINSTOR cluster – Satellites and Controllers – as well as the LINSTOR Controller process itself. This provides administrators with a way to measure and monitor the health of the control plane in a LINSTOR cluster.
If you’re running LINSTOR, the controller is already exposing Prometheus metrics. You can simply curl the metrics endpoint to see the LINSTOR metrics exposed by LINSTOR on the LINSTOR Controller’s REST port.
# curl 127.0.0.1:3370/metrics
# TYPE linstor_info gauge
linstor_info{gitid="801b2d25781cdfcb526e54541cd6b93c6d378278",buildtime="2022-05-12T05:41:29+00:00",version="1.18.1"} 1.0
# HELP linstor_node_state 0="OFFLINE", 1="CONNECTED", 2="ONLINE", 3="VERSION_MISMATCH", 4="FULL_SYNC_FAILED", 5="AUTHENTICATION_ERROR", 6="UNKNOWN", 7="HOSTNAME_MISMATCH", 8="OTHER_CONTROLLER", 9="AUTHENTICATED", 10="NO_STLT_CONN",
# TYPE linstor_node_state gauge
linstor_node_state{node="linstor-0",address="192.168.222.60",nodetype="COMBINED",encryption="PLAIN",port="3366"} 2.0
linstor_node_state{node="linstor-1",address="192.168.222.61",nodetype="COMBINED",encryption="PLAIN",port="3366"} 2.0
linstor_node_state{node="linstor-2",address="192.168.222.62",nodetype="COMBINED",encryption="PLAIN",port="3366"} 2.0
# TYPE linstor_resource_definition_count gauge
linstor_resource_definition_count 1.0
# HELP linstor_resource_state -1="unknown state", 0="secondary", 1="primary"
# TYPE linstor_resource_state gauge
linstor_resource_state{node="linstor-0",name="linstor_db"} 1.0
linstor_resource_state{node="linstor-1",name="linstor_db"} 0.0
linstor_resource_state{node="linstor-2",name="linstor_db"} 0.0
…snip…
For a full list and description of each metric exposed by the LINSTOR Controller process, check out the docs on LINSTOR’s GitHub.
Since LINSTOR is mainly used as the control plane to provision DRBD replicated block storage on the dataplane, combining metrics from LINSTOR Controller with those exposed by DRBD Reactor will provide a full picture of your storage cluster’s health and performance.
Visualizing Prometheus Metrics using Grafana
LINBIT and our community of customers and Open Source users contribute Grafana dashboards to the Grafana community to help administrators get started in visualizing the most important metrics exposed by both DRBD Reactor and the LINSTOR Controller.
DRBD Reactor’s Grafana dashboard can be used to visualize the health and performance of each of the DRBD devices in your cluster, and comes with some health-checks that will tell you if there are any abnormal DRBD states that need investigating.

The LINSTOR Controller’s Grafana dashboard gives you a single pane of glass for detecting issues that might crop up in your control plane or the storage pools LINSTOR uses to provision replicated block storage.

Again, these are intended as starting points for visualizing and monitoring your storage clusters. You’re likely to find some combination of metrics to track which are important to your organization that we’ve not considered. If you’ve got a dashboard or combination of specific metrics that your organization finds useful in monitoring, consider joining the LINBIT community or reaching out to us directly!


