
This blog post discusses the ‘Prometheus’ plugin, which implements a prometheus.io compatible metrics endpoint. But, first, for a more general introduction to ‘drbd-reactor,’ please read the overview blog post.
Motivation
Proper monitoring of DRBD® resources has been a messy task for too long. There are various monitoring solutions, and as DRBD is widely used, there are plugins/agents/importers that can monitor DRBD resources. Many of these plugins I’ve seen in the wild use creative shell scripts to get information out of ‘/proc/drbd.’ Using ‘/proc/drbd’ has multiple disadvantages:
- while we don’t break it intentionally, there is no stable ‘API’ (e.g., it changed from DRBD 8.4 to 9.0).
- it was meant to be consumed by humans, not programs. One could consider it a proprietary format that mainly consists of colon-separated key/value pairs.
There are alternatives to ‘/proc/drbd’ that are less popular. One of these is the JSON output of ‘drbdsetup status’ introduced some time ago for DRBD 9. There are also ‘drbdsetup events2’ that produce a stream of DRBD events. While the format for ‘events2’ is basically simple key/value pairs per line for several event types, it still needs some work to parse it and correlate its output to DRBD resources, their volumes, connections, peers, etc. In fact, DRBD Reactor uses ‘events2’ as its DRBD event source.
Given these existing solutions where some need custom parsers for ‘proprietary’ text formats, we saw room for improvement for input that does not even have a defined stable ‘API.’
Implementation
We first had to decide which monitoring solution we wanted to support first. That was relatively simple, as we saw that Prometheus is the standard nowadays, and there have been requests for Prometheus support from customers and the FLOSS community. Even if there are users who don’t use Prometheus/Grafana directly, there is a plugin for their favourite monitoring solution that can consume the Prometheus metrics format. Even if not, it is then easier and more reasonable to write such a plugin for their platform that consumes the easy-to-handle Prometheus format than to start ‘grep’ing around in ‘/proc/drbd.’
The plugin is simple to use as there is not much need for configuration:
$ drbd-reactorctl edit -–type prometheus prometheus
[[prometheus]]
id = “prometheus”
enums = true
# address = “0.0.0.0:9942”
The shown command opens an editor with the displayed content. Save it, and you are done. After saving the file and DRBD Reactor picking up the changes, one can query the collected metrics via ‘curl -s localhost:9942/metrics’ and configure Prometheus/Grafana as usual. The plugin exposes various DRBD states and statistics like DRBD resource states, volume states, connection states, out-of-sync statistics, etc. For a complete list of metrics, please check the plugin’s documentation.
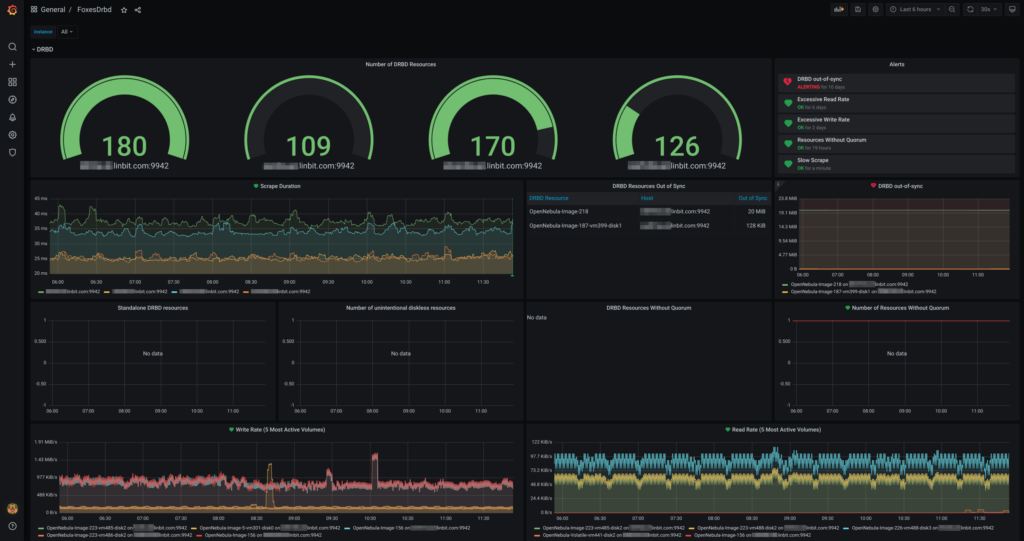
The DRBD Reactor GitHub repository contains an example Grafana dashboard that might be a good starting point for some users. The dashboard looks as follows:
Conclusion
The Prometheus plugin is easy to set up and use. It avoids ‘grep’ing around in ‘/proc/drbd’ or ‘drbdsetup’ output and provides a standardized output format (i.e., the Prometheus metrics format). This output can then be used by various monitoring and graphing solutions. Adapters for different monitoring solutions usually should not be needed as most of them can already consume Prometheus metrics or have a generic Prometheus metric import plugin. Even if that should not be the case, writing such a plugin should be trivial.